Over the past decade, marketing organizations at enterprise companies have grown from being perceived as cost centers built around soft metrics to being highly respected drivers of measurable business growth. Data and science now permeate a part of the organization that was once thought of as “the art department” at best—and ancillary at worst.
The same evolution has happened for product marketers, particularly as it pertains to their competitive intelligence efforts. But just because CI provides an outlet for a PMM to tie their efforts to the core business objectives, it doesn’t mean that it’s easy or intuitive to actually do that.
For example: If you’re a CI expert who is supporting a sales team by creating and curating a set of competitive battlecards, I’m willing to bet that you’ll agree with one or both of the following statements:
- Proving the revenue impact of your battlecards program is difficult.
- Determining how to manage your time and effort around individual competitors is also difficult.
And with these difficulties, of course, come corresponding frustrations:
- Senior stakeholders underestimate—or have a hard time understanding—the value of competitive intelligence, thus hindering the growth of your program.
- You waste your limited energy on the competitors and deals that, for all you know, promise very little in terms of ROI.
A vicious cycle is created, and ‘round and ‘round we go.
Well, I’ve got good news: By adopting a metric that we call influenced revenue, you can help senior stakeholders recognize the value of your competitive intelligence program while simultaneously improving your CI workflow.
Here’s how it works.
Compete like you mean it. Get a demo of Crayon ↓
The simple mechanics of influenced revenue
I think it’s important that we properly frame your expectations: This is NOT a new idea. Attributing revenue impact to competitive intelligence is something that CI experts have been trying to do for years, with many of them creating formulas that look something like this:
(Win % with battlecards - Win % without battlecards) * # of opportunities * AOV = $$$ impact
Hard to picture? Let’s try it with some hypothetical numbers …
(0.3 - 0.15) * 3,000 * $8,000 = $3,600,000
… and that gets us to the interpretation that battlecards have driven an additional $3.6M in revenue.
Now, for what it’s worth, I don’t think this is an unreasonable interpretation, but it requires a leap of faith on behalf of your senior leadership. If they ask to check your math, you may be put into the unenviable position of having to explain why “average order value” and “win rate percentage” factored into a calculation that, on its surface, should be a bit more concrete.
And if those stakeholders are real sticklers for data, they might take umbrage with your inability to get into “the specifics,” a place where they spend a lot of their time. So when it comes time to request additional headcount, budget, and visibility for your CI program, those decision-makers might compare your (expensive) request with your (opaque) impact metrics and say:
We’ve made several concurrent investments in sales enablement. How can you say with certainty that your battlecards are responsible for the improvement in our win rate?
You can’t. Even if you’ve got the engagement data to show that your AEs are head-over-heels for your battlecards, you can’t say that with certainty—which means that, in the eyes of the powers that be, your $3.6M figure is illegitimate.
What you need is a way to measure the amount of revenue tied to actual engagement with specific battlecards—and that’s precisely the purpose of influenced revenue.
Consider this: Lily, an AE on your team, books a discovery call with a prospect called Flex and creates a new opportunity in Salesforce. During that call, she learns that Flex is also evaluating one of your competitors, Compose, and she makes sure to note that in the opportunity record in your CRM. Fast forward 6 months, 11 calls, and countless emails, and Lily finds in her inbox a signed contract from Flex—a contract worth $48K.
The idea is simple: If, at any point between the creation and closure of that Salesforce opportunity, Lily viewed your Compose battlecard, that battlecard would be credited with $48K in influenced revenue.
No back-of-the-napkin math. No complex equations. No eyebrow-raising assumptions. Just 3 simple facts:
- The deal was worth $48K.
- While the deal was in progress, the account executive consulted a battlecard.
- The battlecard corresponds to the competitor that was involved in the deal.
I know what you’re thinking: It’s almost absurd how simple that is.
A week later, let’s say another AE on your team, Craig, beats out Compose in a competitive deal worth $33K. And just like Lily, at one or more points between the creation and closure of the opportunity, Craig paid a visit to your Compose battlecard.
In a matter of days, that’s a total of $81K in influenced revenue—for just one of your battlecards.
Proving your impact
Now, let’s be clear about what we are and are not saying.
We’re not saying that you can slap “$81K IN INFLUENCED REVENUE” on a PowerPoint slide and expect your boss’ boss to immediately say, “Excellent—we’re tripling your budget tomorrow.”
What we are saying is that influenced revenue is a far more accurate, tangible, and defensible measure of your bottom-line impact than anything scratched on a Post-It Note or sliced and diced in an Excel spreadsheet. You’ll be asked to explain yourself, and with an influenced revenue number you can stand behind, you’ll be able to explain yourself confidently.
We’re also not saying that an AE viewing a battlecard is necessarily the same as an AE using a battlecard. Let’s be honest: There’s an “air gap” between a battlecard view and the words coming out of a sales rep’s mouth, or even a crucial detail sticking in their brain.
But that’s where the word “influence” comes in: Even if an AE didn’t use a talking point from your battlecard—verbatim—during a sales conversation, the act of brushing up on both relevant intel and your company’s value proposition may have had some subconscious effect—some “influence”—over their success in closing the deal.
So, ultimately, what we are saying is this: When you approach senior leaders with questionable calculations, you run the risk of fielding questions that you can’t convincingly answer. But when you approach senior leaders with influenced revenue, you make the value of your contributions nearly impossible to ignore.
Amplifying your impact
The best KPIs are the ones that enable you not only to say, “Hey, I’m doing a good job,” but also to allocate your time and energy as efficiently as possible, thus amplifying the impact of your work until you’re no longer doing a good job—because you’re doing a great job.
Influenced revenue is one of those KPIs.
Let’s oversimplify and say that you have two competitors: Compose and Segment. You have battlecards for both, and although feedback from sales has been largely positive, you know that neither of them is perfect. Both are lacking, for instance, a section that’s dedicated to common landmines and tactics for navigating them.
You’ve got a decision to make: Which battlecard are you going to focus on for the next few weeks?
Two signals immediately come to mind: Frequency and win rate. The more frequently your AEs encounter a competitor—and the more intensely they may struggle with that competitor—the more priority you should give that competitor. So, if you find yourself in a situation like this one …
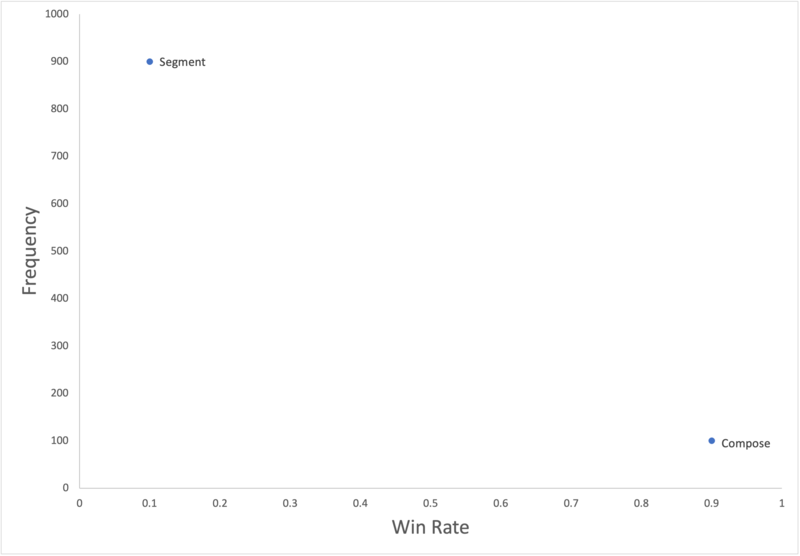
… the choice is obvious: Focus on Segment. But if you find yourself in a situation like this one …
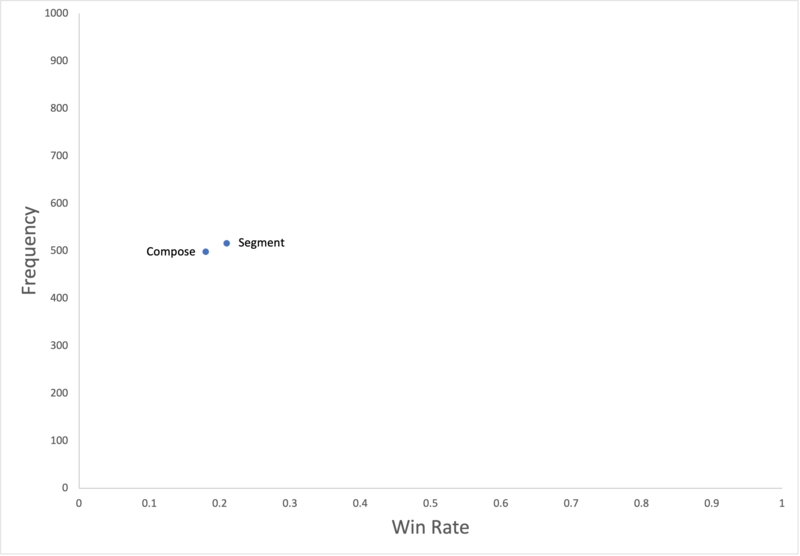
… the choice is far from obvious. So, you need another signal—an additional layer of data to point you in the right direction. That additional layer of data, of course, is influenced revenue (represented here by bubble size):
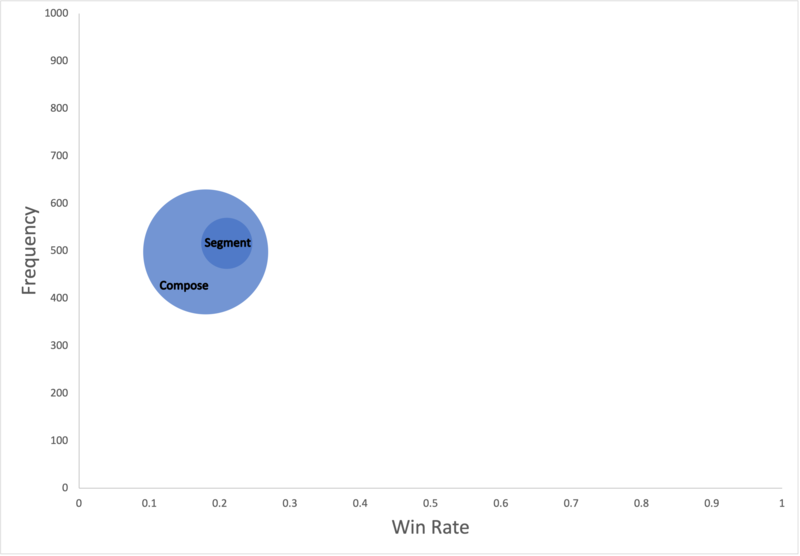
Frequency? Practically equal. Win rate? Basically the same. Influenced revenue? Significantly different. Given that a win over Compose is worth several times more than a win over Segment, it’s on the former that you should focus your limited time and energy—for now, that is. Used in conjunction with other KPIs, influenced revenue helps to ensure that you’re always capitalizing on your most promising opportunities.
A metric that matters
In the same way that marketing is no longer seen as “arts and crafts,” product marketing is no longer simply the “voice of the customer.” As long as competitive intelligence remains within the purview of a product marketing team, both their efforts and the impact that they can deliver are now measurable, understandable, and hopefully—at some point in the future—predictable, just like the KPIs that our teammates in content marketing and demand generation have had for 10-plus years.
See for yourself
If you’re eager to start proving and amplifying your impact on sales with influenced revenue, it’s now available as a battlecard-level metric for Crayon customers who have the Impact screen (and Salesforce Connector) properly configured.
Not yet part of the Crayon family? Click the banner below to request a customized demo of our CI software platform and a member of our team will happily show you how influenced revenue works.

Seeing is believing! Check out Crayon for yourself.
Take a Product TourRelated Blog Posts
Popular Posts
-
 The 8 Free Market Research Tools and Resources You Need to Know
-
 6 Competitive Advantage Examples From the Real World
-
 How to Create a Competitive Matrix (Step-by-Step Guide With Examples + Free Templates)
-
 24 Questions to Consider for Your Next SWOT Analysis
-
 How to Measure Product Launch Success: 12 KPIs You Should Be Tracking

